Lighthouse
This page has been taken from https://jupyterlab.readthedocs.io/en/stable/developer/contributing.html?highlight=performance#performance-testing
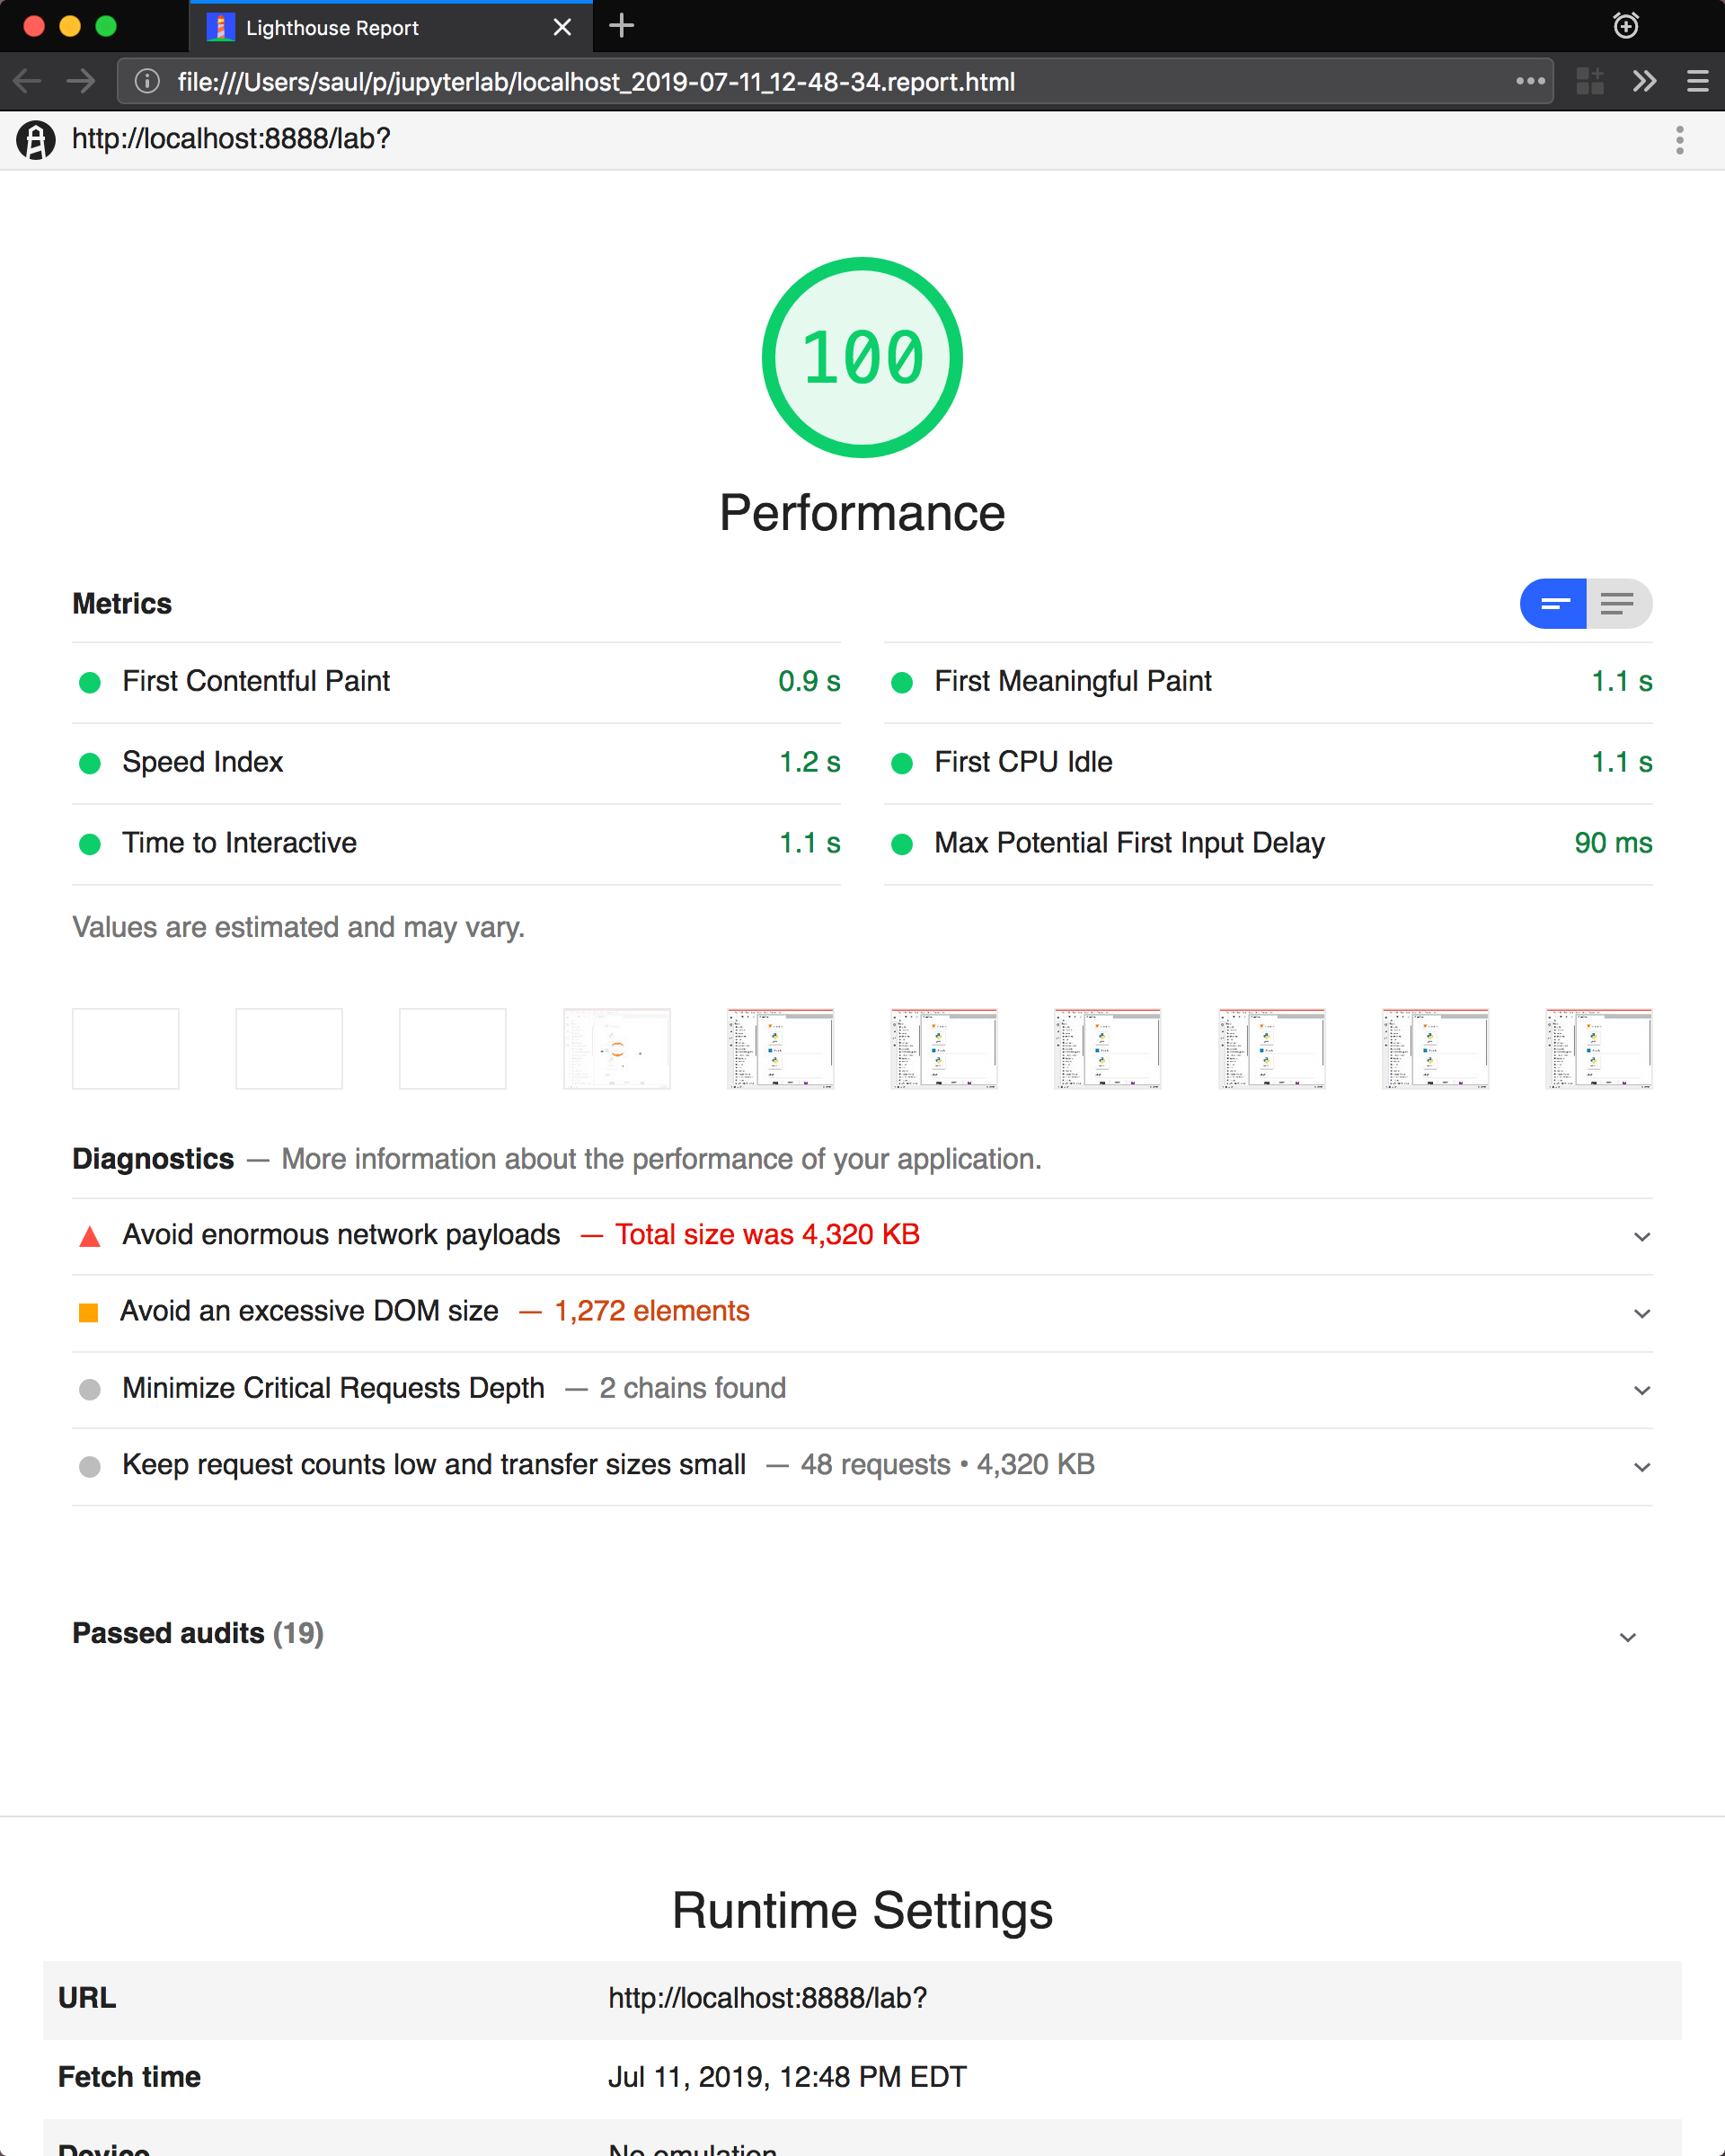
If you are making a change that might affect how long it takes to load
JupyterLab in the browser, we recommend doing some performance testing
using Lighthouse. It
let’s you easily compute a number of metrics, like page load time, for
the site.
To use it, first build JupyterLab in dev mode:
Then, start JupyterLab using the dev build:
jupyter lab --dev --NotebookApp.token='' --no-browser
Now run Lighthouse against this local server and show the results:
jlpm run lighthouse --view
Using throttling
Lighthouse recommends using the system level
comcast tool to throttle
your network connection and emulate different scenarios. To use it,
first install that tool using go:
go get github.com/tylertreat/comcast
Then, before you run Lighthouse, enable the throttling (this requires
sudo):
run lighthouse:throttling:start
This enables the “WIFI (good)” preset of comcast, which should emulate
loading JupyterLab over a local network.
Then run the lighthouse tests:
jlpm run lighthouse [...]
Then disable the throttling after you are done:
jlpm run lighthouse:throttling:stop
Comparing results
Performance results are usually only useful in comparison to other
results. For that reason, we have included a comparison script that can
take two lighthouse results and show the changes between them.
Let’s say we want to compare the results of the production build of
JupyterLab with the normal build. The production build minifies all the
JavaScript, so should load a bit faster.
First, we build JupyterLab normally, start it up, profile it and save
the results:
jlpm build:dev
jupyter lab --dev --NotebookApp.token='' --no-browser

# in new window
jlpm run lighthouse --output json --output-path normal.json
Then rebuild with the production build and retest:
jlpm run build:dev:prod
jupyter lab --dev --NotebookApp.token='' --no-browser

# in new window
jlpm run lighthouse --output json --output-path prod.json
Now we can use compare the two outputs:
jlpm run lighthouse:compare normal.json prod.json
This gives us a report of the relative differences between the audits in
the two reports:
Resulting Output
normal.json -> prod.json
First Contentful Paint
- -62% Δ
- 1.9 s -> 0.7 s
- First Contentful Paint marks the time at which the first text or
image is painted.
Learn
more.
First Meaningful Paint
- -50% Δ
- 2.5 s -> 1.3 s
- First Meaningful Paint measures when the primary content of a
page is visible.
Learn
more.
Speed Index
- -48% Δ
- 2.6 s -> 1.3 s
- Speed Index shows how quickly the contents of a page are visibly
populated.
Learn
more.
Estimated Input Latency
- 0% Δ
- 20 ms -> 20 ms
- Estimated Input Latency is an estimate of how long your app takes
to respond to user input, in milliseconds, during the busiest 5s
window of page load. If your latency is higher than 50 ms, users
may perceive your app as laggy.
Learn
more.
Max Potential First Input Delay
- 9% Δ
- 200 ms -> 210 ms
- The maximum potential First Input Delay that your users could
experience is the duration, in milliseconds, of the longest task.
Learn
more.
First CPU Idle
- -50% Δ
- 2.5 s -> 1.3 s
- First CPU Idle marks the first time at which the page’s main
thread is quiet enough to handle input.
Learn
more.
Time to Interactive
- -52% Δ
- 2.5 s -> 1.2 s
- Time to interactive is the amount of time it takes for the page
to become fully interactive.
Learn
more.
Avoid multiple page redirects
- -2% Δ
- Potential savings of 10 ms -> Potential savings of 10 ms
- Redirects introduce additional delays before the page can be
loaded.
Learn
more.
Minimize main-thread work
- -54% Δ
- 2.1 s -> 1.0 s
- Consider reducing the time spent parsing, compiling and executing
JS. You may find delivering smaller JS payloads helps with this.
JavaScript execution time
- -49% Δ
- 1.1 s -> 0.6 s
- Consider reducing the time spent parsing, compiling, and
executing JS. You may find delivering smaller JS payloads helps
with this.
Learn
more.
Preload key requests
- -100% Δ
- Potential savings of 240 ms ->
- Consider using <link rel=preload> to prioritize fetching
resources that are currently requested later in page load.
Learn
more.
Uses efficient cache policy on static assets
- 0% Δ
- 1 resource found -> 1 resource found
- A long cache lifetime can speed up repeat visits to your page.
Learn
more.
Avoid enormous network payloads
- -86% Δ
- Total size was 30,131 KB -> Total size was 4,294 KB
- Large network payloads cost users real money and are highly
correlated with long load times.
Learn
more.
Minify JavaScript
- -100% Δ
- Potential savings of 23,041 KB ->
- Minifying JavaScript files can reduce payload sizes and script
parse time.
Learn
more.
Enable text compression
- -86% Δ
- Potential savings of 23,088 KB -> Potential savings of 3,112 KB
- Text-based resources should be served with compression (gzip,
deflate or brotli) to minimize total network bytes.
Learn
more.
Avoid an excessive DOM size
- 0% Δ
- 1,268 elements -> 1,268 elements
- Browser engineers recommend pages contain fewer than ~1,500 DOM
elements. The sweet spot is a tree depth < 32 elements and fewer
than 60 children/parent element. A large DOM can increase memory
usage, cause longer
style
calculations,
and produce costly
layout
reflows.
Learn
more.