Benchmarks Tooling
Contents
Benchmarks Tooling#
This package is using Playwright to execute a given scenario with test notebooks.
Running test#
To run the test, you will need to
Start JupyterLab after compiling it at a reference state with the following command
jupyter lab --config tests/jupyter_lab_config.py
Run the tests against the reference
yarn install
yarn build
cd tests
yarn playwright install chromium
yarn test --project jupyterlab -u
Stop JupyterLab
Start JupyterLab after compiling it a challenger state
jupyter lab --config tests/jupyter_lab_config.py
Run the tests against the challenger
cd tests
yarn test --project jupyterlab
The benchmark report is generated in the folder benchmark-results.
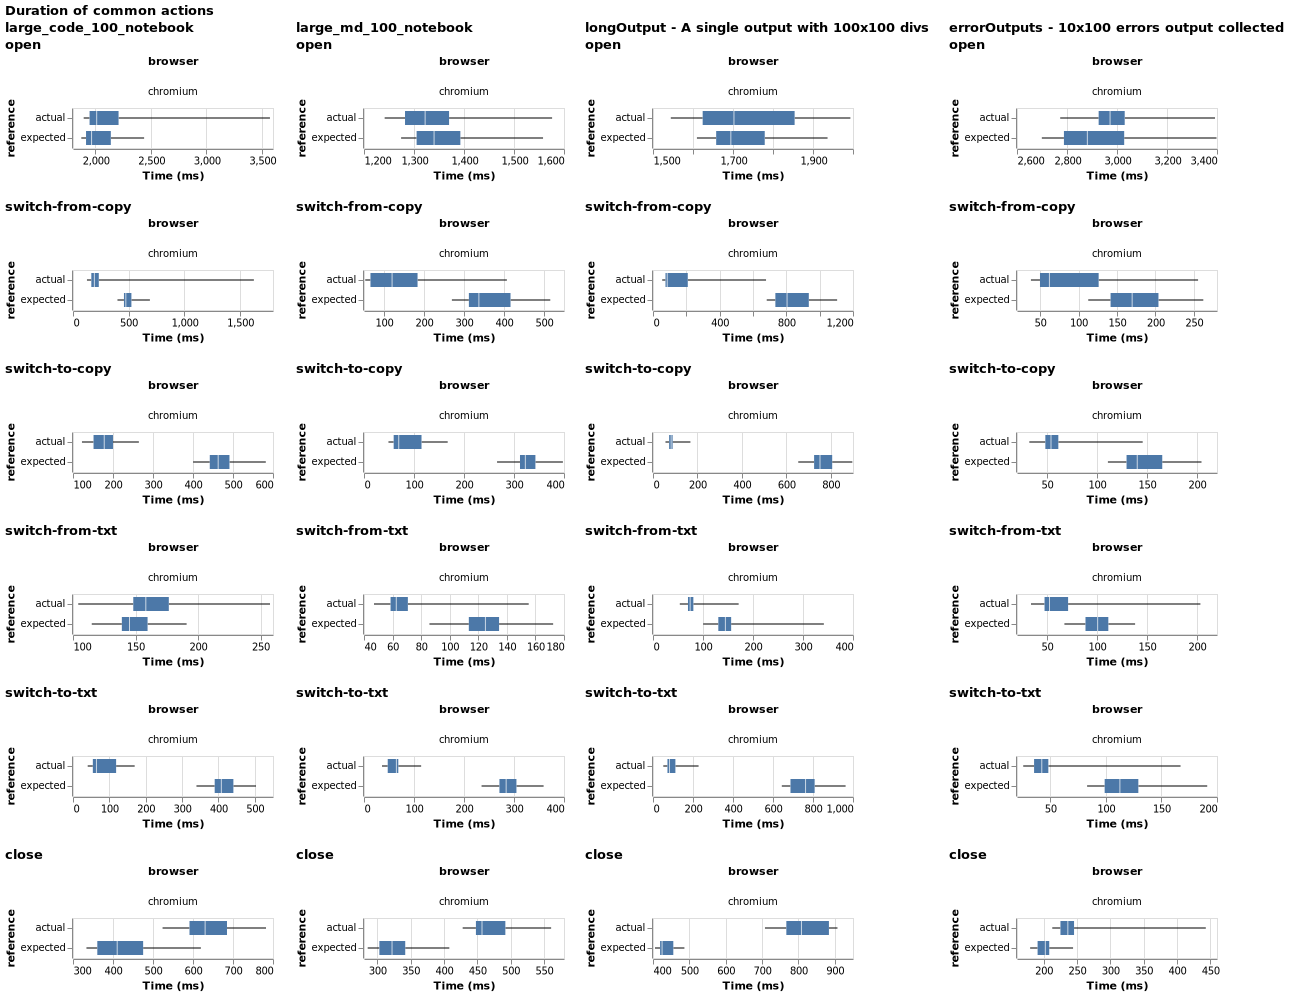
It represents the execution time distribution for the reference JupyterLab version vs the challenger one. Each column represents a test notebook. And each row represents a measurement in the benchmark scenario:
open: Time to open the notebook
switch-from-copy: Time to switch from the notebook to its copy
switch-to-copy: Time to switch back from the copy to the notebook
switch-from-txt: Time to switch from the notebook to a text editor
switch-to-txt: Time to switch back from the text editor to the notebook
search: Time to find a word in the notebook (not available on all notebooks)
start-debug: Time to start the debugger
close: Time to close the notebook (and display the text editor)
Understanding the tests#
As part of the tests, screenshots are generated after various actions and are expected to match the existing screenshots stored in the repository. The tests fails when the screenshots do not match and the benchmark report is not generated. The existing screenshots can be updated by using the flag -u, as was done while running the tests against the reference above.
Using the flag -u also sets the values from the current run as the baseline values (expected) in the benchmark report. These values are stored in tests/tests-out/lab-expected-benchmark.json. The values from the next run without -u are marked as the actual values in the benchmark report.
Generating benchmark report when the screenshot mismatch is expected#
Sometimes, it is necessary to run benchmark tests against two versions across which there are expected UI changes. In this case, the tests against the challenger will fail since the screenshots do not match and the benchmark report will not be generated. Simply using -u to set the challenger’s screenshots as the expected ones will be a mistake here, since this will also set the challenger’s values as the baseline in the benchmark report.
In this scenario, do the following -
Run tests against the reference using
-u: this sets the expected screenshots and stores the baseline values.Save the file
tests/tests-out/lab-expected-benchmark.jsoncreated by the previous step to another temporary location.Run a small sample of the tests against the challenger with
-u: this resets the expected screenshots and creates new baseline values inlab-expected-benchmark.json.Overwrite
lab-expected-benchmark.jsoncreated in Step-3 with the one created in Step-1.Now, run the tests against the challenger without using
-u.
With this sequence, the challenger tests will not fail since the expected screenshots are the ones from Step-3, generated by the smaller sample of the challenger itself. The baseline values from reference are also retained to be the expected values in the benchmark report since they overwrote the ones the challenger sample created.
Test notebooks#
The available notebook definitions are located in the /src/notebooks folder (some have special requirements - see below):
codeNotebook: Only lots of code cells (without outputs).errorOutputs: One cell with lots of error outputs.fixedDataTable: Use test extension fixed-data-table.largePlotly: Four large Plotly.longOutput: One cell with one long HTML output.manyCells: Lots of cells.manyOutputs: Lots of outputs.manyPlotly: Lots of small Plotly.mdNotebook: Only lots of markdown cells.
Requirements#
The test notebooks with Plotly requires to install plotly and ipywigets:
pip install plotly ipywidgets
If you need one of the test extension (like fixed-data-table), you can install it with:
pip install -v extensions/fixed-data-table
Customization#
The benchmark test can be customized through environment variables:
BENCHMARK_NUMBER_SAMPLES [default : 100]: How many samples to compute the statistical distribution
BENCHMARK_SWITCHES [default: 3]: How many times to switch between each tabs
BENCHMARK_MAX_N [default: 100]: The test notebook size
BENCHMARK_NOTEBOOKS [default:
["codeNotebook", "mdNotebook", "largePlotly", "longOutput", "manyPlotly", "manyOutputs", "errorOutputs"]]: Notebooks to test
Benchmarks comparison#
The benchmarks comparison uses the technique from Tomas Kalibera and Richard Jones in their paper “Quantifying Performance Changes with Effect Size Confidence Intervals.” From their abstract:
Inspired by statistical methods used in other fields of science, and building on results in statistics that did not make it to introductory textbooks, we present a statistical model that allows us both to quantify uncertainty in the ratio of (execution time) means and to design experiments with a rigorous treatment of those multiple sources of non-determinism that might impact measured performance. Better still, under our framework summaries can be as simple as “system A is faster than system B by 5.5% ± 2.5%, with 95% confidence”, a more natural statement than those derived from typical current practice, which are often misinterpreted.