Experiments
Contents
Experiments#
The experiments source folder contains code useful to find the root cause of the issues.
Simple Notebook#
Editor Comparison#
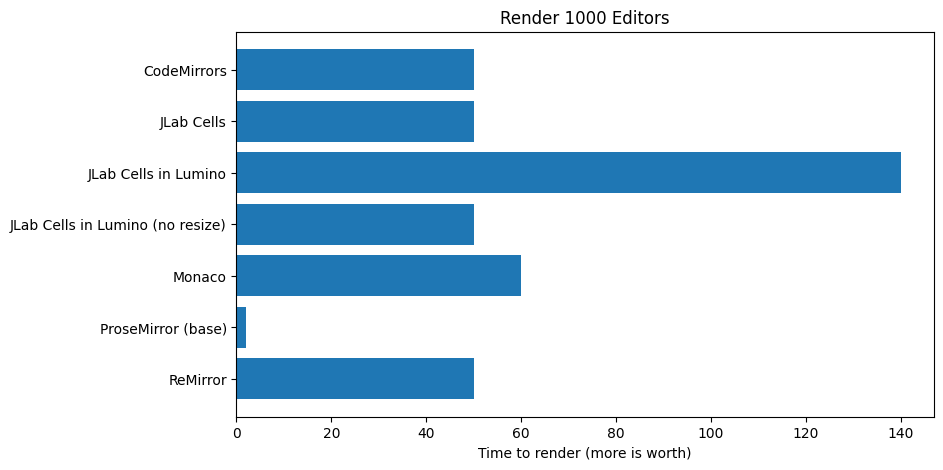
We compare for different editor technologies the time (in seconds) needed to receive the DOMContentLoaded event for 1000 editors.
1000 CodeMirrors: 50 seconds.
1000 JupyterLab Cells: 50 seconds.
1000 JupyterLab Cells in a Lumino BoxPanel: 10 seconds for DOMContentLoaded, cells are only shown after 140 seconds.
1000 Monaco: 40 seconds for DOMContentLoaded, editors are only shown after 60 seconds.
1000 ProseMirror (basic version): 2 seconds.
1000 ReMirror: 50 seconds.
Show code cell source
import matplotlib.pyplot as plt
import numpy as np

plt.rcdefaults()
fig, ax = plt.subplots(figsize=(9,5))

"""
1000 JupyterLab Cells: 50 seconds.
1000 JupyterLab Cells in a Lumino BoxPanel: 10 seconds for DOMContentLoaded, cells are only shown after 140 seconds.
1000 CodeMirrors: 50 seconds.
1000 Monaco: 40 seconds for DOMContentLoaded, editors are only shown after 60 seconds.
1000 ProseMirror (basic version): 2 seconds.
1000 ReMirror: 50 seconds.
"""
exp = ('CodeMirrors', 'JLab Cells', 'JLab Cells in Lumino', 'JLab Cells in Lumino (no resize)', 'Monaco', 'ProseMirror (base)', 'ReMirror')
y_pos = np.arange(len(exp))
performance = [50,50,140,50,60,2,50]
ax.barh(y_pos, performance, align='center')
ax.set_yticks(y_pos)
ax.set_yticklabels(exp)
ax.invert_yaxis()  # labels read top-to-bottom
ax.set_xlabel('Time to render (more is worth)')
ax.set_title('Render 1000 Editors')
plt.savefig('./../../../decks/root-causes/images/exp.png')
plt.show()
CodeMirror#
The time measures from 1 to 1000 CodeMirror editors show an non-linear nature.
Show code cell source
import pandas as pd
import matplotlib.pyplot as plt

df = pd.read_csv('./exp/codemirror-comparison.csv')
df.set_index('cell-id', inplace=True)

def plot():
    plt.title('CodeMirrors in HTML')
    plt.xlabel('Number of CodeMirrors')
    plt.ylabel('Time to Display')
    plt.plot(df['base'], label = 'Base')
    plt.plot(df['contain'], label = 'Contain')
    plt.plot(df['operation'], label = 'Operation')
    plt.plot(df['operation+contain'], label = 'Operation+Contain')
    plt.plot(df['next'], label = 'Next')
    plt.legend(bbox_to_anchor=(0.5, 0.6), loc='lower right')

plot()
plt.savefig('./../../../decks/root-causes/images/codemirror-comparison.png')
plt.show()

Show code cell source
import matplotlib.pyplot as plt;
import matplotlib.pyplot as plt

y_pos = ('2.2.8', 'DeLayout', 'Virtual Notebook')
performance = [185, 155, 10]

plt.bar(y_pos, performance, align='center', alpha=0.5)
plt.ylabel('Time to display')
plt.title('1000 Cells Notebook')

plt.savefig('./../../../decks/root-causes/images/fixes-comparison.png')
plt.show()
Lumino actions on resize#
https://github.com/jupyterlab/lumino/blob/master/packages/widgets/src/widget.ts#L610
https://github.com/jupyterlab/jupyterlab/search?q=onResize
https://github.com/jupyterlab/lumino/search?q=onResize